

You don’t need to trade a single option to get value from the options market.
(Most) every stock you own has an entire derivatives market sitting on top of it, constantly repricing the odds of every possible outcome. Hedge funds, institutional desks, professional traders. All of them are putting real money behind their convictions every single day.
That activity gets compressed into one number: implied volatility. And most equity investors completely ignore it.
Here’s how to read it.
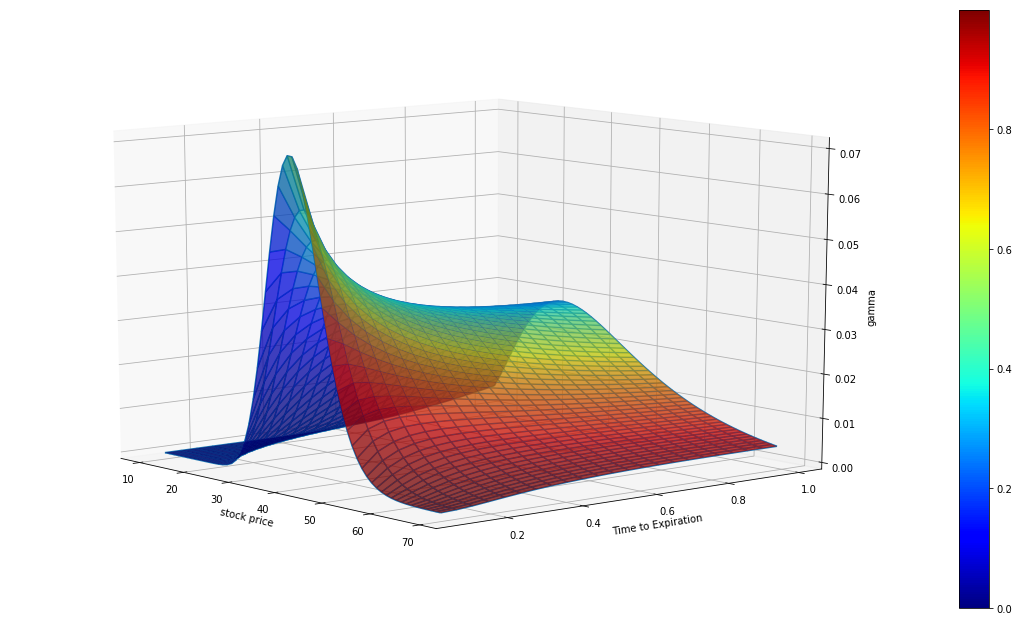
What implied volatility actually is
Implied volatility (IV) is the market’s forward-looking estimate of how much a stock is expected to move, expressed as an annualized percentage.
It’s called “implied” because it’s backed out of the price of an option. Historical volatility measures how much a stock has moved. IV reflects how much the market expects it to move. When option prices are expensive, IV is high. When they’re cheap, IV is low.
Think of it as a fear gauge for a specific stock. A stock with 20% IV is expected to be relatively calm. A stock with 60% IV is expected to swing hard.
But on its own, that annualized percentage is tough to intuit. So here’s how you actually make it useful.
Turning IV into an expected move
The formula is simple:
Expected move = IV ÷ √(trading days in period)
For a daily move, you can simplify: divide IV by √252 (trading days in a year), which is roughly 16. That’s the shortcut worth memorizing.
If a stock has IV of 32%, the market is pricing in roughly a 2% daily move (32 ÷ 16). If IV is 48%, that’s 3% a day.
For a weekly move, divide by √52. For a monthly move, divide by √12.
This gives you a one standard deviation move, meaning the market prices roughly a 68% probability that the stock stays within that range. A 2σ move (which covers ~95% of outcomes) is just double that.
Important: this isn’t a prediction. It’s a probability-weighted range. The market isn’t saying the stock will move 3% tomorrow. It’s saying that given current option pricing, a 3% move in either direction wouldn’t be surprising.
What happens when IV goes Parabolic: GameStop in January of 2021
In late January 2021, GameStop’s implied volatility hit 1,000%. Run that through the formula: 1,000% ÷ 16 = a 62.5% expected daily move. The options market was saying GME could swing 62% in a single session and that would be normal.
Obviously absurd. And it was a massive opportunity for anyone selling premium.
IV almost always overstates the actual move. Options are insurance, and insurance is almost always priced above the expected loss. When IV goes parabolic, that gap between what’s priced in and what actually happens gets enormous.
If you sold options when GME IV was at 800–1,000%, you were collecting premiums that assumed 50–60% daily moves. Realized vol eventually collapsed well below implied, and sellers got paid handsomely as IV crushed back down over the following weeks.
Why this matters right now: SpaceX.
SpaceX filed its S-1 with the SEC on May 20, 2026, confirming plans to list on Nasdaq under the ticker SPCX. Reports point to a debut as early as June 12. This is going to be the largest IPO in history and it’s not even close.
The numbers from the filing are wild. Revenue hit $18.7 billion in 2025, up 33% year over year. Starlink is the engine here: 10.3 million subscribers across 164 countries, $11.4 billion in segment revenue on its own. They also disclosed a $1.25 billion per month cloud compute deal with Anthropic running through May 2029, which tells you something about the scale of AI infrastructure they’re building at their Colossus data centers in Tennessee.
But SpaceX also lost $4.9 billion in 2025 and $4.3 billion in just Q1 2026. Capital expenditures nearly doubled to $20.7 billion as xAI (which SpaceX acquired in February 2026) burns cash at an extraordinary rate. The company carries $29.1 billion in long-term debt. The AI segment alone posted a $6.35 billion operating loss in 2025.
The self-assessed valuation in the prospectus is $1.25 trillion. Media reports suggest the final pricing could land anywhere between $1.75 trillion and $2 trillion. At the midpoint, that’s roughly 94x trailing revenue for a company that is deeply unprofitable on a GAAP basis. For context, Tesla’s price-to-sales ratio at its 2010 IPO was a fraction of that.
Now here’s the part that actually matters for this article. The float is expected to be roughly 5% of shares outstanding. Musk has earmarked 30% of the offering for retail investors, which is triple the typical IPO allocation. Demand is expected to be 10–20x oversubscribed. And under Nasdaq’s fast-track entry rules, SPCX would qualify for Nasdaq-100 inclusion after just 15 trading days, triggering forced buying from every index fund and ETF tracking it.
Think about what happens to IV on day one of SpaceX options trading. You’ve got a company valued north of a trillion dollars, massive retail interest, a tiny float, forced index buying on a compressed timeline, and the Elon Musk premium baked in. IV will almost certainly be extreme.
I think we could see something approaching the levels from the GME/AMC meme stock frenzy of 2021.
META: What the Market is Pricing right now
Let me ground this in a real example with a stock I own.
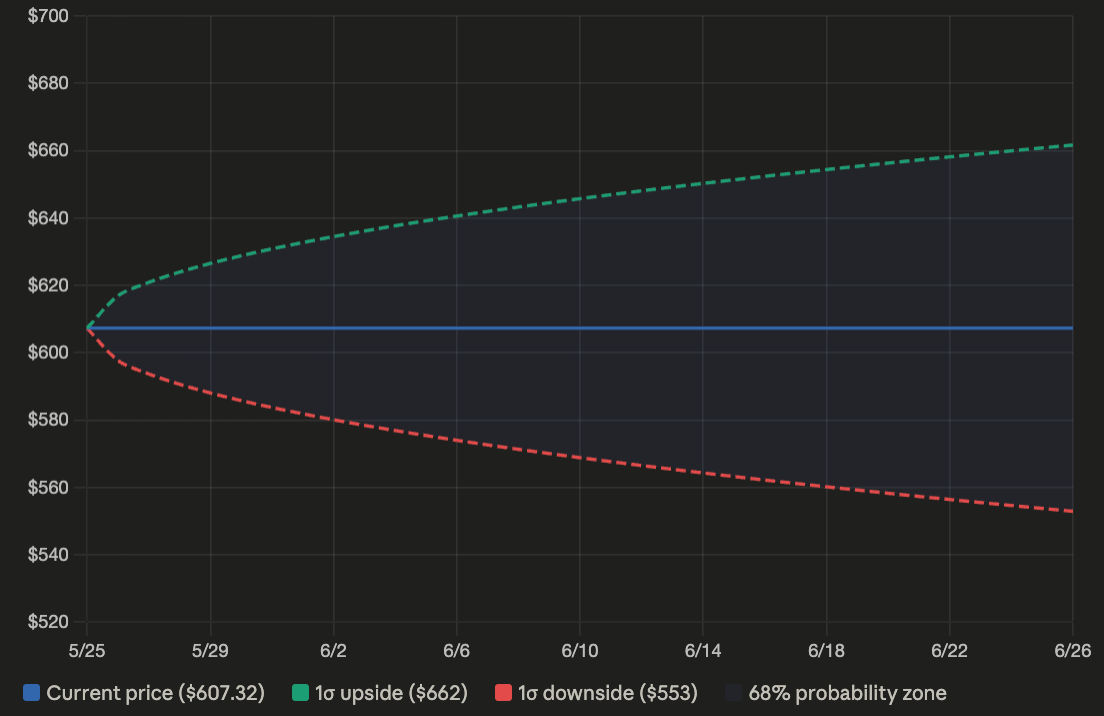
META is trading at $607.32 as I write this. The $610 call expiring June 26 (about 32 days out) has an implied volatility of 30.24% and a delta of 0.5343.
Plugging into the formula:
$607.32 × 0.3024 × √(32 / 365) ≈ ±$54.35
That puts the market’s 1σ expected range at roughly $553 to $662 by June 26.
That’s the cone below:
A few things worth noting.
This range reflects the aggregate positioning of every participant pricing META options right now. It’s not one analyst’s opinion. It’s the market’s collective bet, backed by real money.
IV of 30.24% is moderate for META. The IV rank is sitting around 23–25, meaning current implied volatility is near the low end of its range over the past year. The market is not pricing in much event risk over the next month, which makes sense because META’s next earnings report isn’t until July 28. Between now and June 26, there’s no major catalyst on the calendar.
The range here is symmetric, but skew (the difference in IV between puts and calls at equal distances from the current price) can shift it. If put skew is elevated, it pushes the downside boundary wider, which means the market is more worried about a drawdown than a rally.
Delta: the market’s implied probability of hitting a level
The cone gives you the range of what a stock could do. Delta gives you the odds of hitting any specific price within that range, or beyond it.
Delta is a Greek that options traders use to measure how much an option’s price moves relative to the stock. But it also works as a rough proxy for the market-implied probability that a stock reaches a given strike by expiration.
A call with a delta of 0.50 sits right at the money. The market is pricing roughly a 50/50 chance the stock finishes above that strike. As you move the strike higher, delta falls, reflecting lower odds of the stock getting there in time.
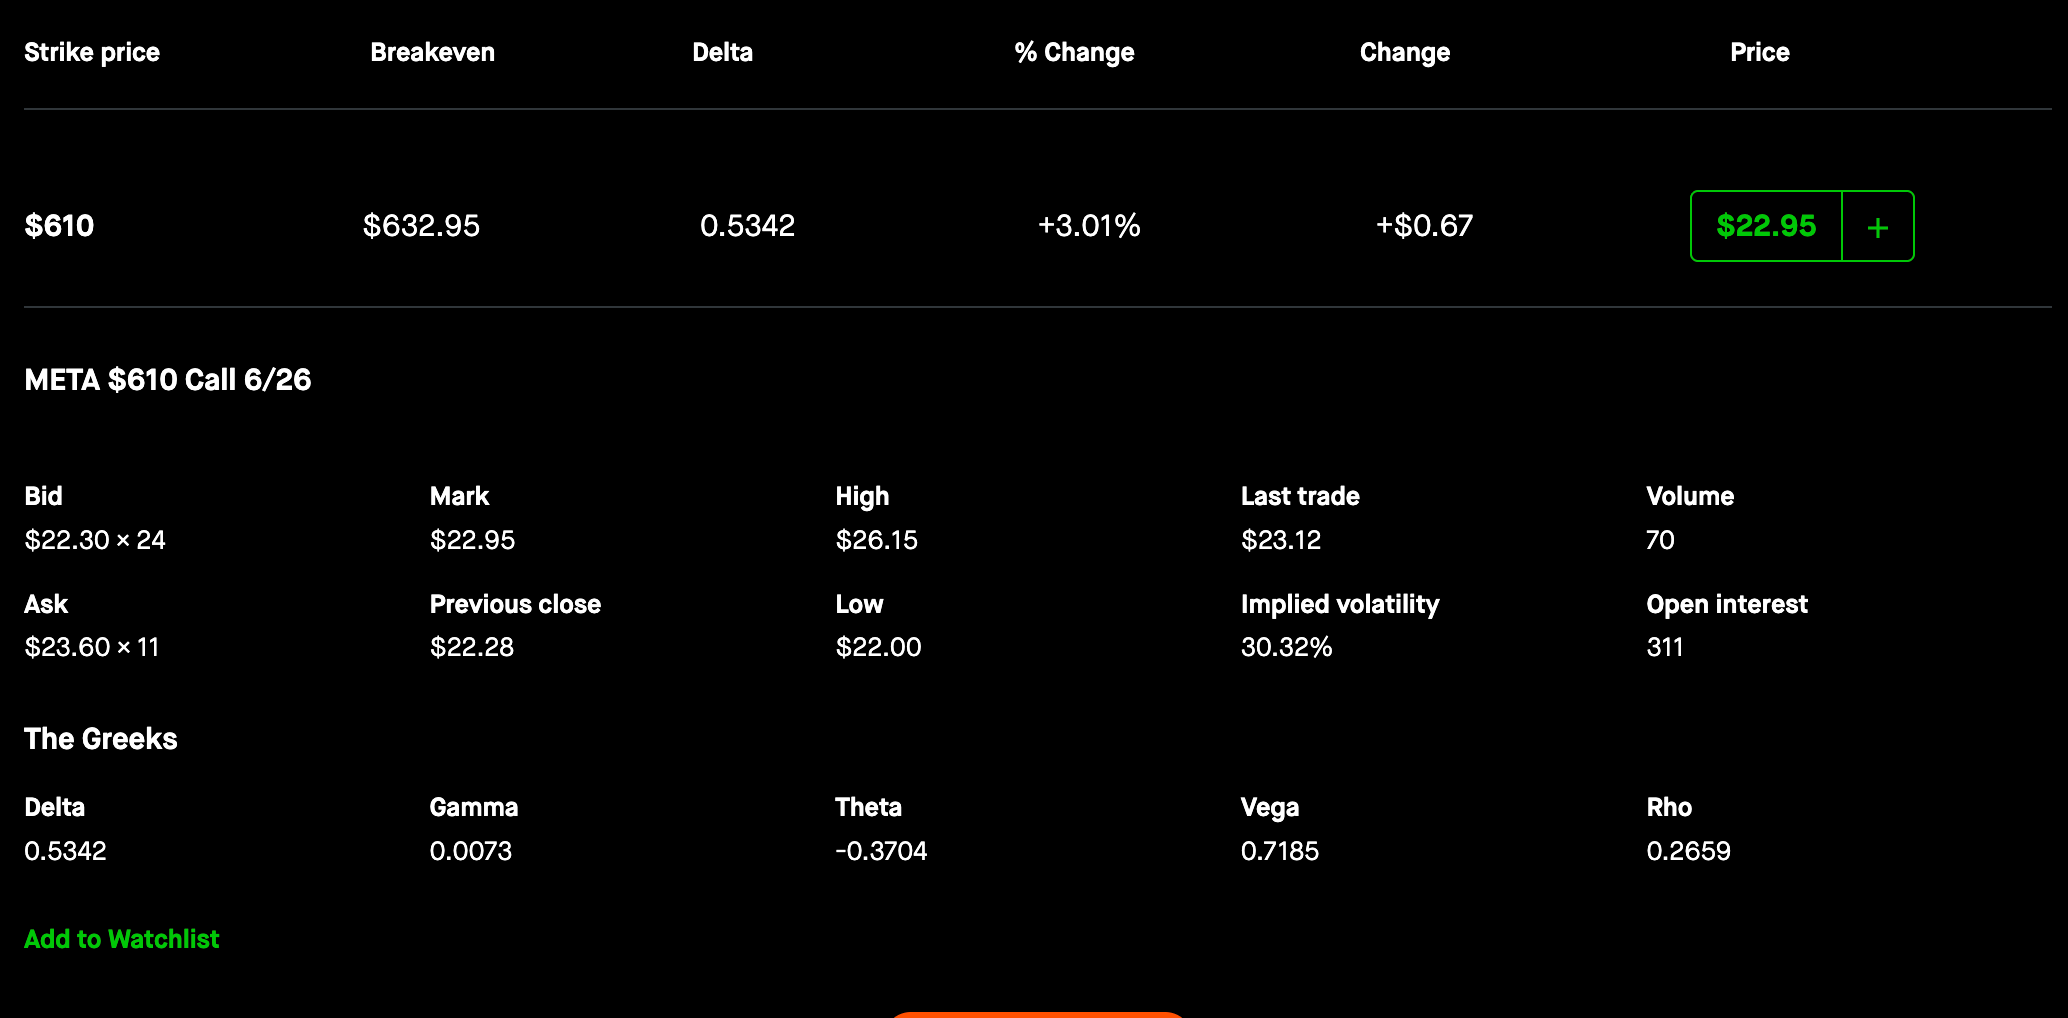
Back to META. The $610 call expiring June 26 has a delta of 0.5343. The market is pricing about a 53% chance META is above $610 in 32 days. Basically a coin flip, which makes sense since the strike is right near the current price.
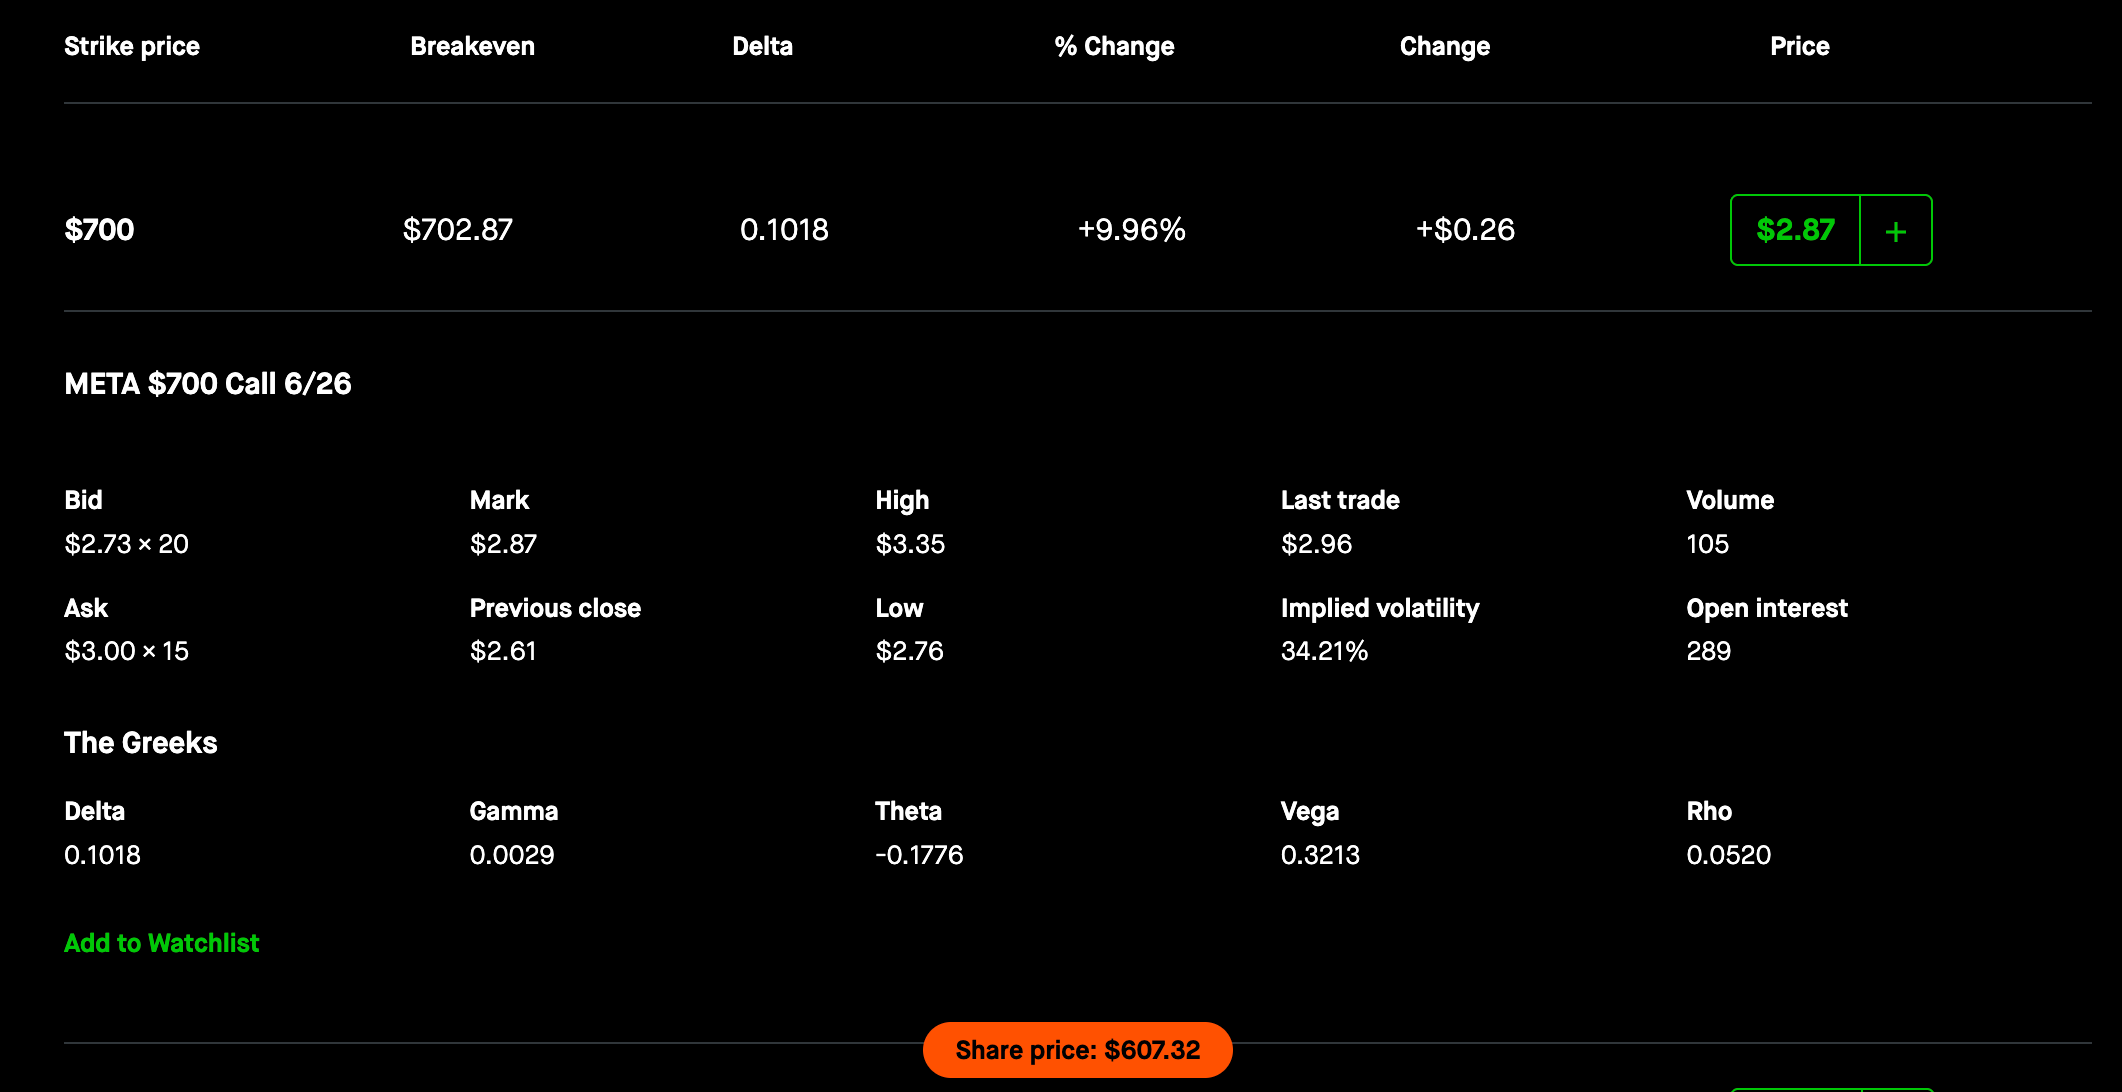
Now think about a $700 call on the same expiry. You’d be looking at a delta around 0.10. The market would be saying there’s roughly a 1-in-10 chance META rallies 15% in a month. Not impossible. But the options market, with real money behind it, is pricing that as a low-probability outcome.
This is useful even if you never touch an option. It’s helpful to play around with options, looking at different deltas at different time horizons to understand what probability the market is ascribing to certain outcomes.
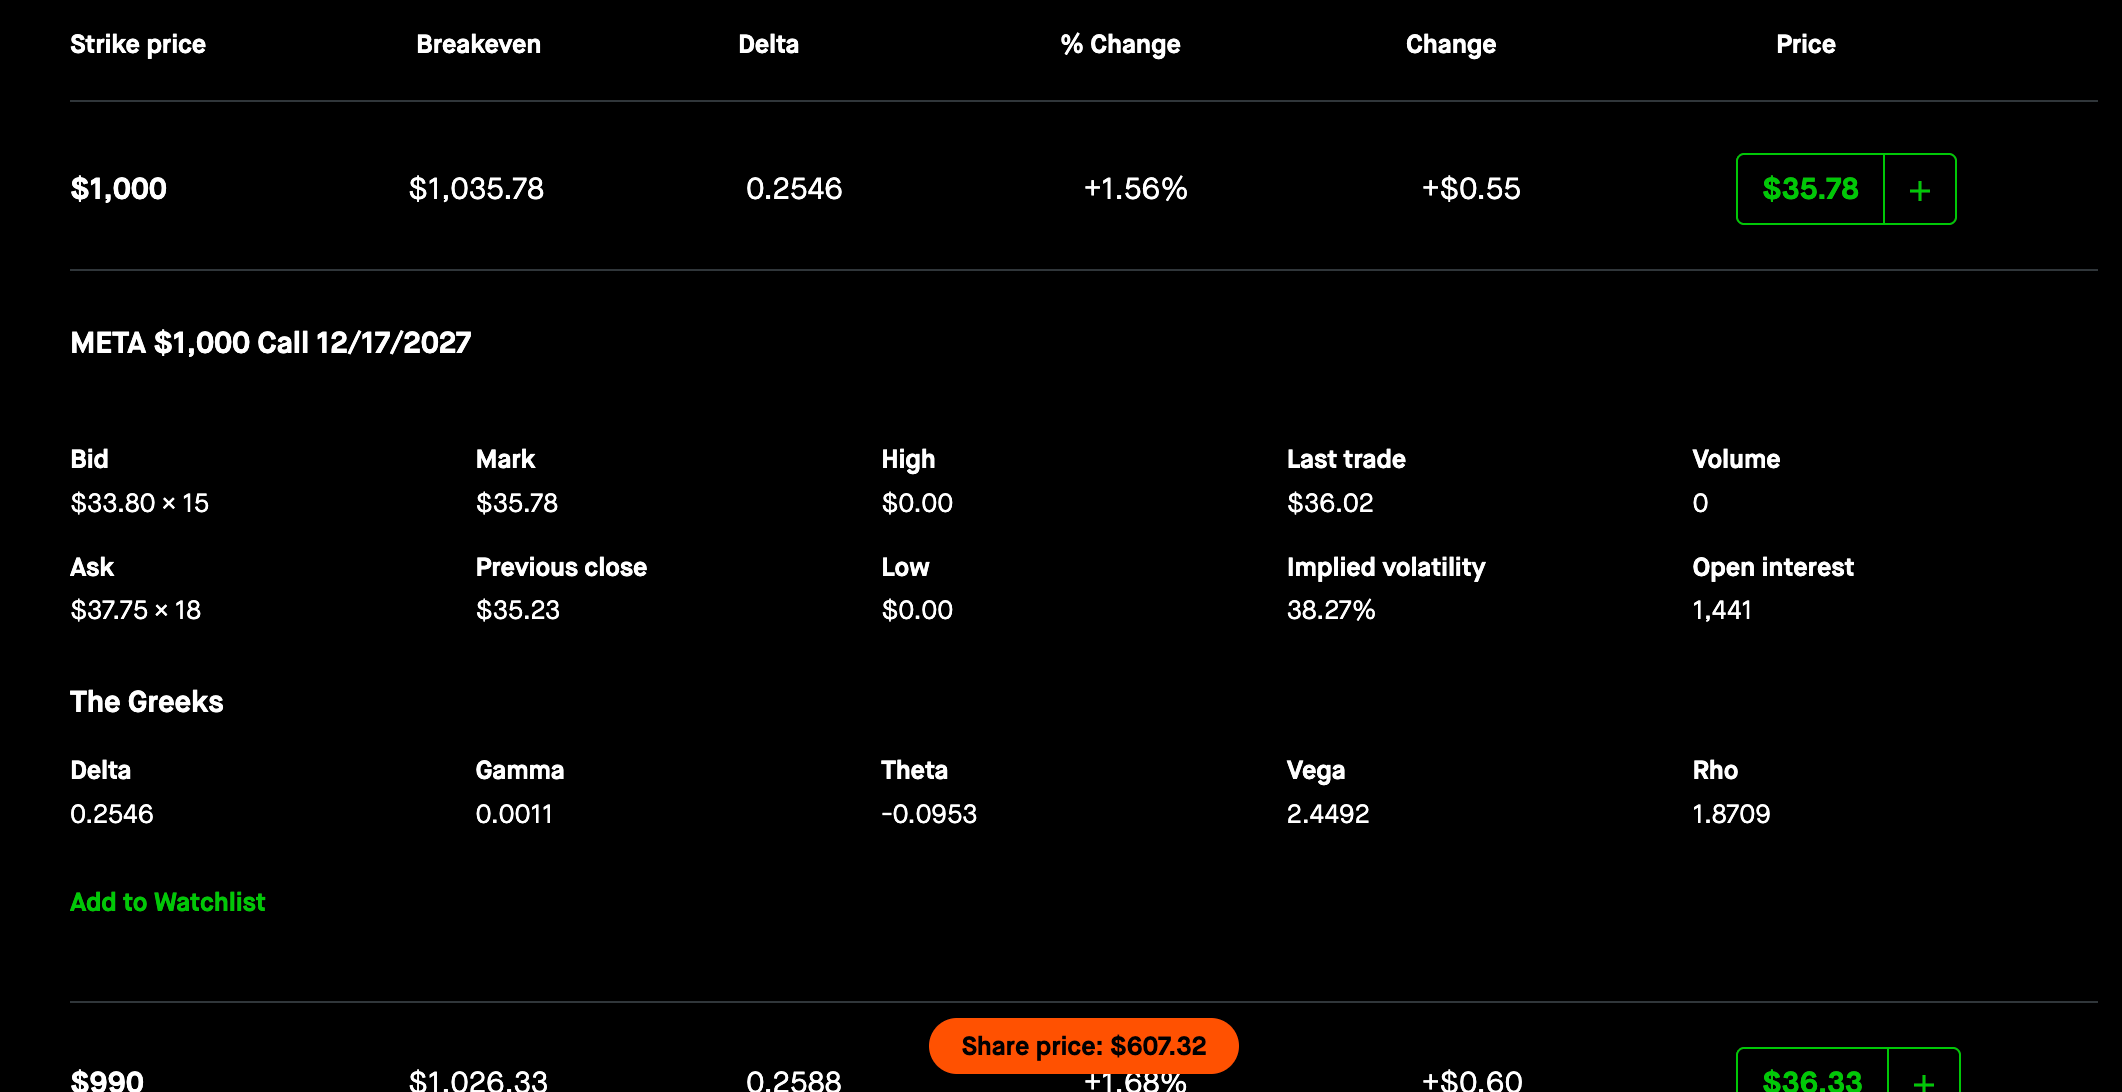
For example, I am a META bull, and my current price target for 2027 is $1000. If we take a look at $1000 December 17, 2027 calls, the market is only giving a ~25% chance of META hitting that level.
Put volume: when the market is actively hedging
IV tells you how much movement is priced in. Delta tells you the odds of hitting a specific level. But there’s a third signal worth watching: put volume, or how aggressively market participants are buying downside protection.
In early April, SPY put volume surged past 9 million contracts. That’s the third-largest single-day spike on record. Institutions, funds, and sophisticated traders paying real money to hedge against a drawdown.
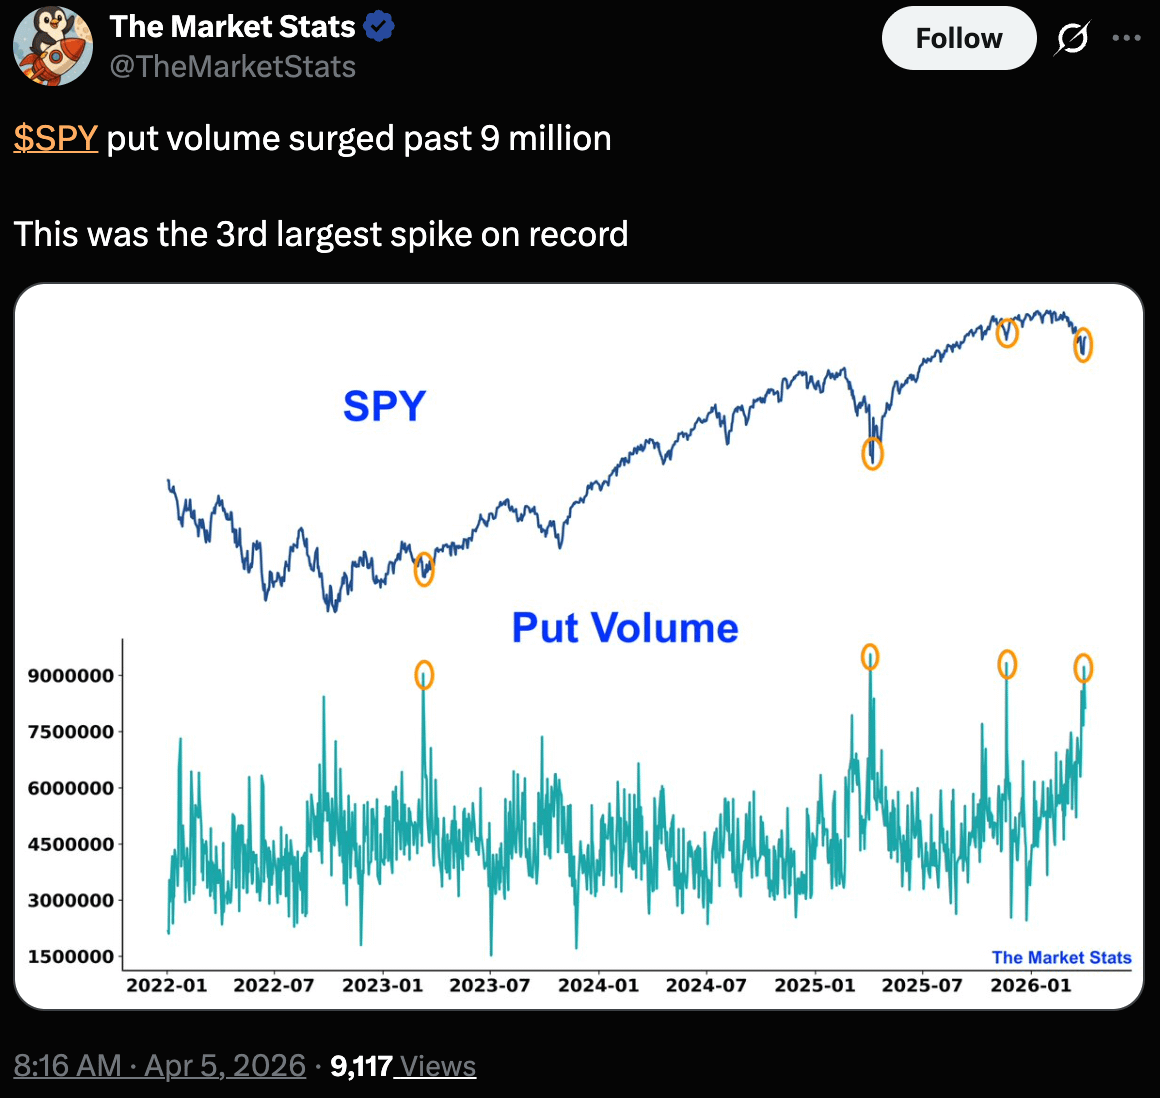
When you see that kind of spike, it doesn't mean a crash is coming. It means the people who manage the most money in the world are collectively saying: the risk/reward of not hedging is worse than the cost of insurance. That's a signal worth paying attention to, even if you never buy a put in your life.
How to use this as an equity investor
You don’t need to trade options. But knowing this range changes how you think about your position.
Position sizing. If you’re long META and the market is pricing a ±12% move over the next month, that’s $70/share of expected volatility. Are you comfortable with that level of volatility?
Setting price targets. If you have a 12-month price target well inside the 1σ annual range, the market considers that part of the base case.
Evaluating conviction. High IV means options are expensive, which means the market is uncertain.
Timing entries. IV tends to mean-revert. Buying LEAPS on a stock when IV is at a multi-year low means you’re entering when the market is pricing in low volatility. That can be opportunity, as you have two outs to profits: share price appreciation and implied volatility expansion.
Where to find this data
All of this is freely available.
Any Modern Brokerage — Robinhood, IBKR, Fidelity, etc. (their options chains)
Market Chameleon — IV percentile rank, historical IV vs. realized
Other Thoughts & Updates
I’m drafting an Eli Lilly ($LLY) write up that I plan to post in the next few weeks. I think it’s trading at a fair multiple, right in the GARP-range and has a massive tailwind if Retatrutide (reta) gets FDA approval. If Reta is legally cleared as a biological compound (big differentiator) I think $1150-$1200 is likely as that will give them a much longer exclusivity window. I personally think that based on their EPS estimates and forecasted growth, $1500 by ~mid 2028 seems feasible. No position yet but I plan to open call spreads soon.

Disclaimer: This is not financial advice, do your own due diligence please.